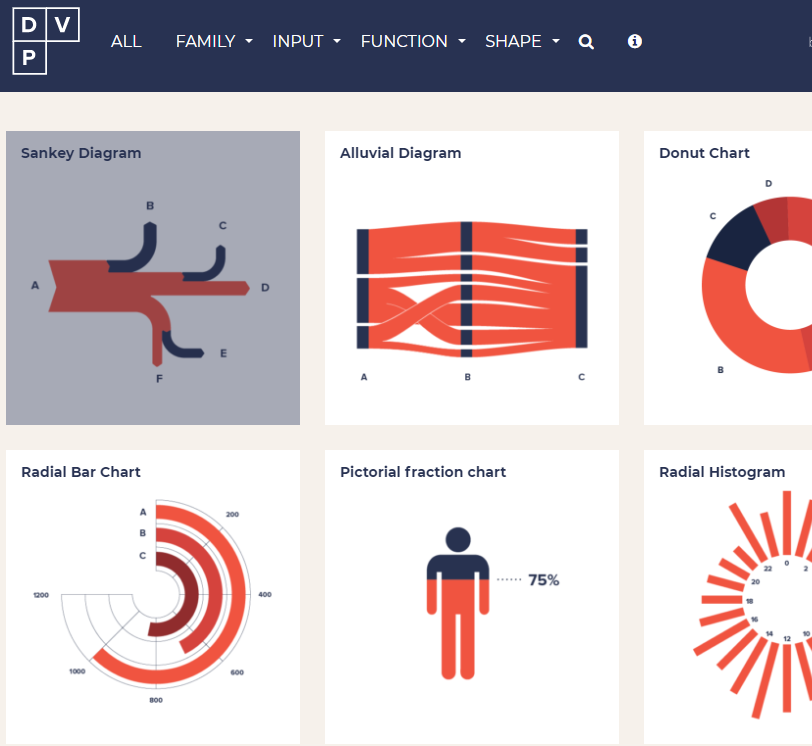
Data Viz Project
DATAVIZPROJECT contains thumbnails of different chart types. DVP is a great site to visit when in the early stages of analysis when looking for some inspiration. It’s unique in the way you can search for chart by how your data is structured (Input in the top navigation) or by the chart’s intended Function (e.g. correlation, trend over time, part to whole, etc)
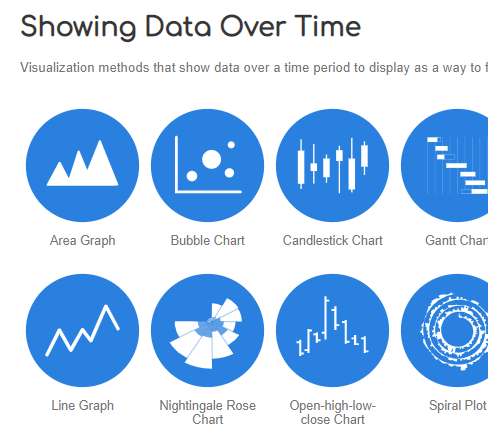
The Data Visualization Catalogue
THE DATA VISUALIZATION CATALOGUE is similar to the link above (Data Viz Project) in that it’s a series of well designed icons that show different chart types. This site loses points for being covered in ads, but can still be a helpful resource when looking to get “unstuck”.
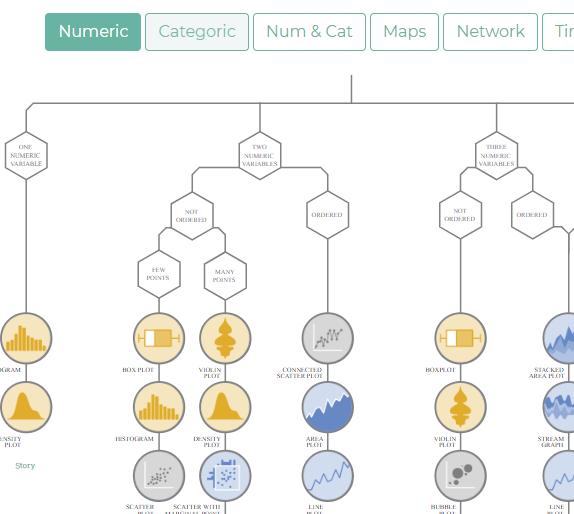
from Data to Viz
from DATA to VIZ is one of my favorites for picking the right chart types. It is a well designed decision tree (that makes for a great poster) that has just about every chart type you can think of. You can click into each of the chart types to discover suggested use-cases and common pitfalls for each one. Bonus - they link directly to different languages and for to write the code that would build these (with things like R or Python).